The Story Behind Discovering the Digital Humanities

Hi everyone! The past few posts I’ve made on the blog have been part of my most recent project called “Discovering Digital Humanities with the OSU Library.” Hopefully you’ve had a chance to view some of them and get an idea of just how much DH is going on here at OSU! I’ve really enjoyed getting to meet faculty from different departments and discuss DH with them. This blog post discusses a bit of the background behind the project and some themes that I’ve noticed throughout the interviews.

My intern committee came up with the idea for this project in the Fall of 2020 and I began planning out the project with hopes for a launch in the middle of the semester. One of the main goals for this project was to have it live past my time as an intern, since I’m a senior and will be graduating in May 2021. Thus, it was vitally important to document every step of the project by creating an easy to follow workflow that detailed every single aspect of the project. This work flow includes a list of potential interviewees organized by department, the template for pretty much any email that the interviewer will have to send, editing guidelines, and even sample questions for the interview. When the next intern comes along, they’ll be able to start at the top of the document and won’t have to wonder about a thing!

There’s also a handy dandy tracking spreadsheet. It includes the list of who I’ve asked to participate, what date I received a reply, all the way through the project until the final step: emailing the interviewee the video. The purpose of this sheet is to make sure that nothing falls through the cracks, ensuring that the intern is being professional. 

The actual interview doesn’t take very long, about twenty minutes, and I enjoy having a real conversation with the interviewee. While I have a set list of questions prepared, I rarely use them, instead letting the conversation flow naturally. I like to think that there are two distinct portions of the conversation: the part about the project the interviewee has been working on and the part about DH in general; questions such as “How did you get interested in DH?” Many of these professors have used these projects in their classes and so I love asking about student’s reactions to DH.

While the interview doesn’t take long, the editing takes a bit of time. I go through about three versions for each video and cut out the superfluous parts, long pauses, and sometimes rearrange parts of the interview. After my supervisors have reviewed it, it’s published on YouTube and the intern blog with a short description. 

There are a few themes that I’ve noticed throughout the interviews. First, are the themes of collaboration and understanding DH. Most of the interviewees aren’t “computer people.” They don’t have a background in computer science and said they were really nervous to start their project. However, they all went on to have successful projects because they got help, usually from the library, and it is this theme of collaboration that ultimately made their projects successful.

One other theme is teaching students how to interact with DH. Surprisingly, for many of these classes, it has made history, or English, or Art History, more accessible to the students. It’s not just about the history, its making history easy to understand for all students. This is a big part of why the digital aspect of study is important for the humanities: it makes the humanities relevant, accessible, and useful to students, faculty, and the public. 

I hope that this project will continue past me, and that you enjoy the upcoming videos!

-Claire
Discovering Digital Humanities with Louise Siddons

In the third episode of Discovering DH, hosted by OSU Library Digital Humanities Intern Claire Patton, we talk to Dr. Louise Siddons, Associate Professor of Art History, about her digital history project using Modex to highlight the history of art exhibitions at OSU.

Discovering Digital Humanities with Lisa Hollenbach

In the second episode of Discovering DH, hosted by OSU Library Digital Humanities Intern Claire Patton, we talk to Dr. Lisa Hollenbach, Assistant Professor of English, about using podcasts to help students understand written, spoken, and performative poetry. 

Working in Wikipedia

Hello, readers! It’s been quite a while since I’ve posted. I hope that your summer was restful and you are prepared for the whirlwind that comes with the start of school. This summer I had the opportunity to work with Wikipedia which is a project that I’ve been wanting to try for a while. As an added benefit, it was a low-stress project, making it perfect for summer! 

I’m sure that Wikipedia plays an important role in providing you with information- you may even use it more than you realize! Wikipedia is handy for getting a brief overview of a topic, looking at the forest rather than the trees so to speak. In today’s blog post, I’m going to discuss what I did with this project, what I learned about the editing process, and bust some myths about the reliability of Wikipedia. 

I began this project by doing a few Wikipedia trainings. Wikipedia has put out several trainings geared towards various groups who might be interested in editing, such as students, professors, professionals, and those doing Wikidata work. I went through all these trainings to see how the trainings differed from each other and to discern the feasibility of assigning a Wikipedia editing project in a class room setting. All in all, these trainings were rather similar, though I would certainly recommend doing the training geared towards the group you most identify with. The trainings were simple to complete and it is easy to go back and quickly reference a page when you’re editing.

Upon completing the training, I began checking on Wikipedia pages that OSU had connections to and making sure the links to OSU’s resources still worked. Through doing this, I would be making more accurate information available to a global audience and giving people easy access to OSU’s resources. Several years ago, another library intern began working with Wikipedia and kept records of her own work, giving me a fantastic starting place. Along with her spreadsheets, I began reviewing her Wikipedia pages. I made my way through OSU’s digital collections and googling different names, such as “Angie Debo” to making sure that OSU’s links still worked on that Wikipedia page. If a page didn’t have links, I was able to add them. Additionally, I kept track of topics or people who didn’t have a Wikipedia page. I haven’t drafted any new pages yet, but I believe that will be my next project!

While working through this process, I learned the truth behind several Wikipedia myths. Many professors like to bash Wikipedia as an unreliable source of information, but it can actually be incredibly useful tool for school research projects. First, Wikipedia provides an excellent overview of a topic, which is a lifesaver when you get bogged down in the tiny details of your research project.

While it is true that anyone can edit in Wikipedia, the information is typically reliable (though you should always take it with a grain of salt!). Those who truly care about editing go through the Wikipedia training which highly encourages editors to use secondary sources and forbids doing primary research. While primary sources, such as interviews, can be used when there’s not much information about the subject, it is the exception rather than the rule. As for random information being uploaded, it is unlikely to stay up as popular Wikipedia pages are constantly updating, thanks to people who care about putting accurate information online. In a sense, popular Wikipedia pages are being peer reviewed.

While the information found on Wikipedia is a great starting place, the “References” and “External Links” sections are the most valuable pages as they contain valuable information that you can use in your papers. Use this resource!

Overall, this Wikipedia project was fun to work on and I enjoyed learning several new skills. I hope you found this article informative and will use Wikipedia to make your next school project a success!

WAVES Week Reflections

Hello, all! Women’s Military History Week ended a few weeks ago and I thought a blog post detailing the process of preparing for that week might be appreciated. 

In the Spring of 2020 my supervisor and I began toying with the idea of publicly celebrating the WAVES program. A bill is circulating in the Oklahoma legislature that would make June 12than official holiday celebrating women in the military. Though the bill has not passed yet, we still wanted to honor the WAVES, provide parents with activities for their children, and showcase the work of the library’s interns. 

First, I compiled a list of all OSU’s resources about the WAVES with links to their online location. This included OSU’s primary sources such as the main collection, yearbooks, and photograph collection. The list also included all the work done by OSU’s interns, such as my data visualizations and this blog, as well as other intern’s Story Maps and podcasts. Later in the process, these items were listed on the main WAVES collections landing page. This allowed visitors to see all the project’s offerings in a consolidated manner.

To publicize what we began to call WAVES Week, I reached out to the Library’s communications team. In working with communications, I learned how to fill out rather in depth social media forms, write snappy social media posts, and use hashtags. The communications team also had several graphic design interns who helped create children’s activities and turn pictures from OSU’s collection into coloring sheets.

I wanted to draw students and young children into this project and in doing so, I created several activity and craft sheets. The craft sheets were inspired by various aspects of the WAVES program. For instance, many WAVES used typewriters in their everyday jobs. One craft sheet had the students create a typewriter from a shoebox so they could pretend to type, just like the WAVES! 

I also attempted to create student activity sheets for older children. These activity sheets focused on the data aspects of the WAVES project, specifically what I worked on during the Fall of 2019. The activity sheets attempted to introduce students to data and how graphs are created, as well as give them a fun activity to help the lesson sink in. Unfortunately, the activity sheets proved difficult to write to our specific needs and we decided to postpone using them until next year. 

Finally, I created several blog posts to supplement the information on the WAVES collections page.  You can view these, of course, on my blog. 

Overall, WAVES week was a success and I enjoyed getting to work on these projects! To view the collection and my work, click here. 

Letters to the WAVES

Hello, all! Today I come to you with a blog post about letters from the WAVES. This past year I’ve been exploring the WAVES program at Oklahoma State University and one of the richest resources I’ve used is the letters from the WAVES. These letters can be found in the WAVES online collection and are enjoyable to read. Since my internship focuses on the technical aspect of doing history, I decided to take the data from these letters and run them through Tableau. For a better explanation of creating data and using Tableau, please check out my previous blog posts! Today, however, I will be showing you the data visualizations I created and providing some context. While this blog post only shows a photograph of the visualizations, I’ve included a link to my Tableau Public page where you can interact with the data. 

During the WAVES program, several professors from the school of Commerce (Business) at OSU were assigned to teach the WAVES, helping to prepare the women for their clerical duties. One such professor was Mr. Leake. He was a beloved teacher and he and his wife often threw parties at their home for the WAVES. Many WAVES wrote to the Leakes after leaving Stillwater and today, these letters are held in OSU’s collection. These letters are a treasure trove which give us a first-hand account of the WAVES’ experience. 

During the 1990s, many WAVES who had trained at OSU began writing to the archives, asking for copies of pictures of the WAVES. While these letters are rather short, they show how far each WAVE went after their service. Many of the letters tell how fondly the women remembered their time at OSU.

These data visualizations tell us more about the WAVES program and their letters. Enjoy!

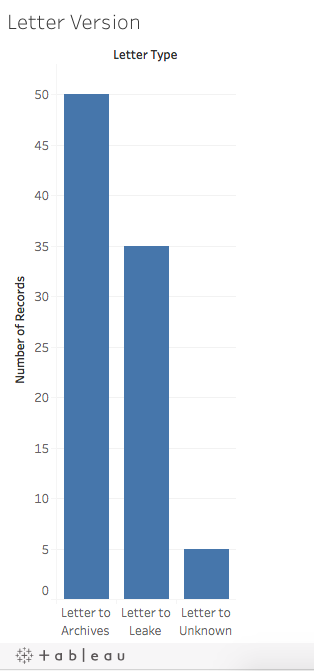
Letter Version

This first image took the total number of letters in OSU’s collection and divided them by whom the letters were written to. Clearly, there are more letters to the archives. The “Letters to Unknown” were written in the 1940s, but it is not clear if they were written to Mr. Leake or a friend or family member.

Medium of Writing

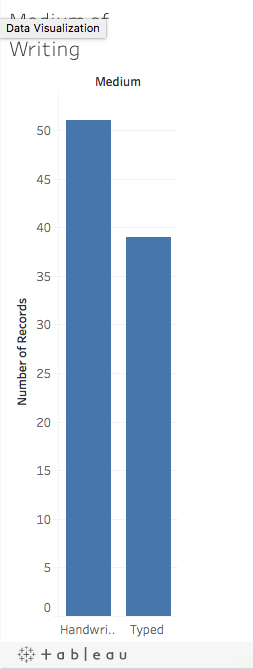
The letters were in one of two mediums- hand written or typed. This graph combines all of the letters, including those to the archives. It is a bit surprising that there are more handwritten letters, as the WAVES typed for their jobs. However, this may be explained by the fact that there are more letters to the archives, which are shorter and perhaps did not need to be typed. 

WAVES Locations

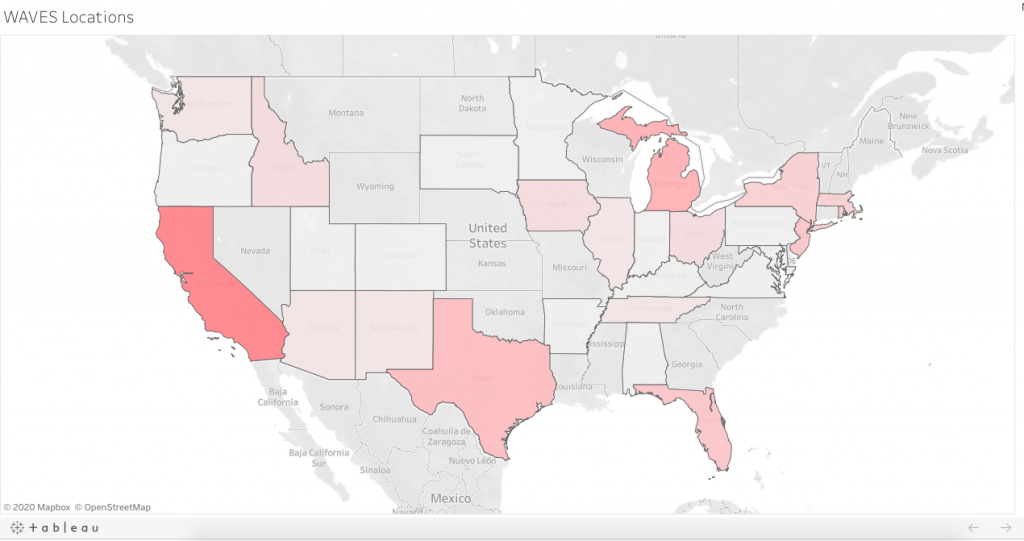
This visualization shows where the letters came from. On the Tableau Public Website, you can interact with this image and see how many letters came from each state. As you can see, the darker states had more letters, such as California and Texas. These states had major Naval bases, where the WAVES worked during the war. 

Date of Writing

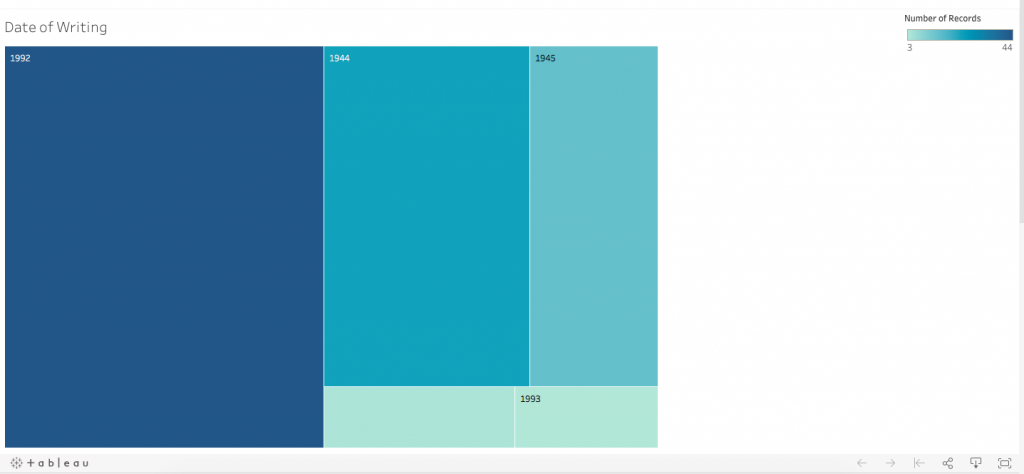
The image above shows the date that the letters were written. Like the previous visualization, you can interact with the data on the Tableau Public website. As you can see, the vast majority of the letters were written in 1992; these are the letters to the archives, as well as the letters from 1993. The other dates, 1944 and 1945, are letters from the WAVES during their service. There is a blank category, which indicates letters that have no date. 

These are all the visualizations from the “Letters from the WAVES” data and I hope that you enjoyed them! Be sure to explore the WAVES landing page and the enjoy the rest of Women’s Military History week.

WAVES Data Visualizations

Hello, faithful readers! This week we’re celebrating Women’s Military History Week, a week where we’re highlighting the contribution of the WAVES program in World War II. Today, I’m going to be showing you some data visualizations I’ve been working on for the past year. These visualizations are on Tableau Public and through that format you can interact with the data. However, on Tableau Public there is no way to explain what these visualizations mean. The purpose of this blog post, then, is to examine the data so you can better understand the WAVES program. 

The data in this set of visualizations comes from the nearly 11,000 WAVES registration cards that the college collected during its time as a training center. I won’t go into much detail here, as I have expounded on this source in previous blog posts. Click here to be taken to the WAVES collection landing page, which is the home base for WAVES week and click here to be taken to my Tableau Public page. Please enjoy!

High School Graduates

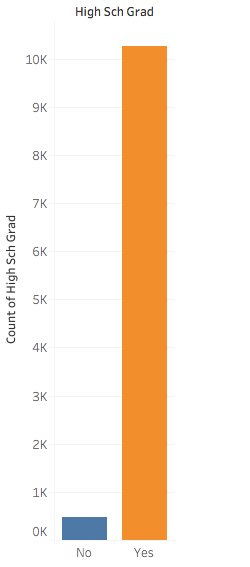
This graph shows the number of WAVES who graduated high school over those who did not graduate. In the WAVES program, graduating from high school was a key requirement to being able to serve. They wanted women who worked hard and were smart, something that graduating from high school indicated. The WAVES program had high standards (such as graduating from high school) for those who joined, which was a key facet to maintaining their good reputation. While a woman could join the WAVES if she had not graduated, she had to fit many more requirements than her graduated counterparts. 

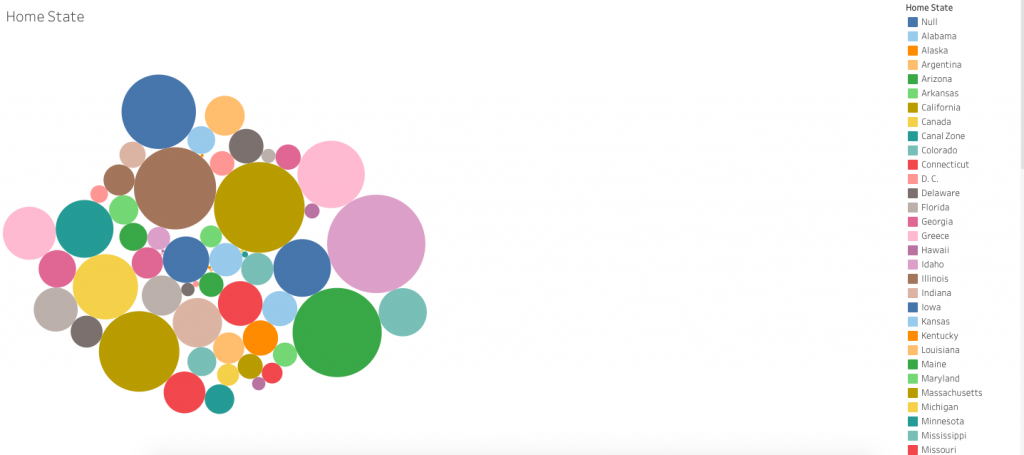
Home State

This visualization shows the home states of the women. There is a key on the right side, which you can scroll through on Tableau Public. This was one of the first visualizations that I created and if I were to do it over, I would do it much differently. A heat map would be the best way to show this data, as it would allow viewers to quickly understand the data rather than having to scroll over each circle to see the number. Moreover, it is difficult to compare numbers, as it is harder to compare the sizes of similar circles. 

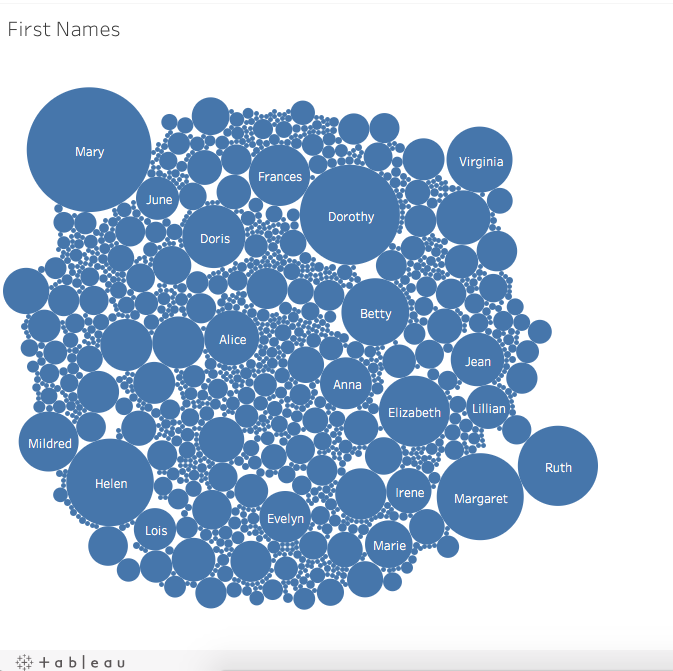
First Names

Our final visualization today is rather fun: a bubble graph of the most common first names of the 10,000 women. While the previous visualization probably should not have been a bubble graph, the bubble graph was a good choice for this data. The bubble graph showcases all the data in an easy to see way, showing the viewer the most important parts while subtly downplaying the less common names.

That’s all from that set of visualizations! Tomorrow, there will be more visualizations, so stay tuned and explore the WAVES landing page!

Bennett and the WAVES

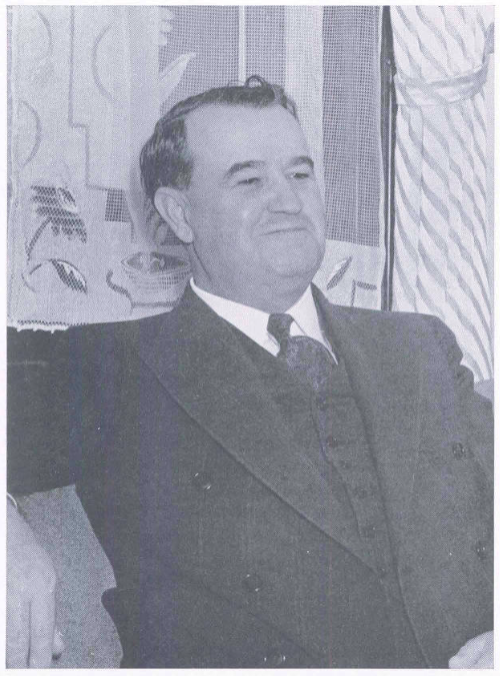
This week, Oklahoma State University is celebrating the WAVES program and their contribution to World War II. This week emphasizes the collection at Oklahoma State University and the WAVES collection landing page gathers information created by students a faculty from all over the university. Today’s blog post focuses on Henry Bennett, the president of OSU during the 1940s and an important part of bringing the WAVES to OSU. Click here to visit the WAVES landing page to view the digital collection, supplemental information, and children’s activities.

Image of President Bennett. 1942 OA&MC Yearbook, 25.

The Women Accepted for Voluntary Emergency Service program was a major facet of life at Oklahoma State University during World War II. It can be argued that the presence of the WAVES program, as well as a variety of other military training programs, allowed the college to remain open throughout the war. The beginning of the WAVES’ time at OSU can be traced back to Henry Bennett, president of OSU and a man with an enduring legacy. Today’s blog post explores his work at the college during World War II and with the WAVES program. 

President Bennett was used to hard times. President from 1928 to 1950, the stock market crashed not long after he began running the college. By the end of the 1930s, the financial situation began to look up, but America’s entrance into World War II brought a second threat of financial ruin (Yearbooks). Young men left the college in droves to join the military and with the fall in revenue from the student’s tuition, the college realized that they could quickly be in dire financial need. From our knowledge of Bennett’s character and the letters he left behind, we can confidently assume that he was quick to act. A man of immense energy, Bennett’s children said that he could often be found awake in the middle of night working furiously (Peters). While we are unable to say with certainty what role Bennett held in bringing the WAVES to campus, a multitude of letters in OSU’s archives show Bennett’s involvement in preparing for the arrival of the WAVES and making sure that they would be well taken care of. Because of these letters and his role as president, we can be sure that Bennett was important factor in bringing the WAVES to campus. 

The WAVES program was a novelty. Before the 1940s, women had not been allowed to serve in the military unless they worked as nurses. However, with the advent of World War II, an immense amount of men were needed to fight. The military decided to mobilize the men who served in clerical duties and replace them with female workers. Before the war, it was considered unfeminine for women to work outside the home (though it must be noted that this was only realistic for a specific portion of society) and women were not allowed in the military. In the time of a national emergency, society began to make an exception and women were allowed in the military (Anderson). Regardless of the war time situation, many branches were not thought of highly. The WAVES were different in this respect, and documents in OSU’s archive show that the citizens of Stillwater and the college welcomed the WAVES with open arms and were extremely proud of the college’s role in serving the country (Water Daughters).

Creating whole new branches of the military from scratch on a limited amount of time proved to be a massive problem. For the male service branches, the military could use preexisting structures for recruitment and training. For the women, however, there were no recruitment or training centers in place. (How these women were recruited can be explored in a previous blog post.) It became patriotic for colleges to give up their space to be used by the military (Yearbooks). In his characteristically energetic style, Bennett wooed many branches of the military to train at OSU, perhaps the largest being the WAVES program. While Bennett may not have intended this initially, the military eventually overran the entire school (Yearbooks). Many of the dorms were given to the military, the WAVES took over Morrill Hall, and many teachers from the business school were enlisted to teach the WAVES (Yearbooks).

Though Bennett had coerced the military to train at OSU, there were still problems a plenty. One of Bennett’s letters to the military showed that the college had been promised a large number of military men, but had not received the full quota. The college had set aside a whole dorm for the men, but half the dorm remained empty and could not be filled with civilian students (Correspondence regarding cancelled quota). Bennett’s careful management of the college’s affairs and willingness to speak up allowed the college to flourish during this period. 

Today, a large but kind looking statue of Henry Bennett peers at students playing Frisbee on Library Lawn. Though most students walk past the statue unawares, Bennett’s legacy at the college remains unheeded by many but strong nonetheless. His tireless work during World War II in bringing the WAVES to campus procured a way for the college to not just to survive, but thrive. A great man, Bennett must be thanked for the legacy that he left the college. 

Recruiting the WAVES

Hi faithful readers! If you’ve been following my blog for a while, you’re familiar with my past work on the Women Accepted for Voluntary Emergency Service program in the 1940s here at Oklahoma State University. Today’s blog post will explain the process of how the WAVES were recruited and I’ll show you a rather cool map I made in ArcGIS and what it tells us about the WAVES program. 

Throughout this project, my supervisors and I wondered how women were recruited into the WAVES program. The program began in 1942 and by the end of the war in 1945 nearly 80,000 women had joined the WAVES. Due to the temporary nature of the WAVES program, we knew that recruitment centers were not scattered across the U.S. like there were for the men in the Navy. An oral history with a WAVE in OSU’s collection told us that the Navy recruitment center in Tulsa, Oklahoma doubled as a WAVES recruitment center, but we wondered if there were other methods of recruitment than just this one center. 

While looking for answers to this question and others, I found a WAVES recruitment pamphlet in the Women Veterans History Archive which proved to be a gold mine! Published in 1944, it was over fifty pages long and entitled “The Story of You in Navy Blue.” Foremost, this booklet gave a glimpse into the thinking behind recruiting the WAVES. The pamphlet argues that a woman can do any job just as well as a man can and that she will be serving her country by joining up. World War II was saw many women needing to work outside the home, something that was socially unacceptable before the war. However, we the hyper-patriotism that accompanied America’s entrance into the war, it became necessary and socially acceptable for women to work in factories or in the army to serve their country. At the end of the booklet was a complete list of recruitment centers in the U.S. As this list was not specific to one region of the U.S., we can know that the reasons the pamphlet gives for becoming a WAVE was a universal message. The Navy did not believe that one specific state or demographic would be turned off by this message. In the hyper-patriotism of the early 1940s, the idea that a woman could do a man-sized job and still retain her femininity while serving her country was a nation-wide message.

The list of recruitment centers gave me another clue as to how WAVES were recruited. By and large, the recruitment centers were located in Post Offices though some were in what appear to be well-known town buildings or other government buildings. In the previously mentioned oral history, the interviewee stated that one of the recruitment centers in Tulsa was a part of a pre-existing Naval recruitment center. While the pamphlet does not say that any of these centers were Naval recruitment centers, it is very possible that they were. When we consider this, as well as the speedy turnaround from when the program was founded to when it started, one might wonder how they could quickly recruit enough women. The answer was to use preexisting infrastructure to reach women- places such as the Post Office.  The recruitment centers were not located in every town, but rather they were placed strategically across each state so that each woman would have access to a recruitment center close to them. As of today, I am unsure what role the Post Office played in the daily life of a 1940s woman and how women who did not live in the same town as a recruitment center were reached, so there is most likely another component to how women were recruited. That could have been a mailing or poster campaign, or simply word of mouth. 

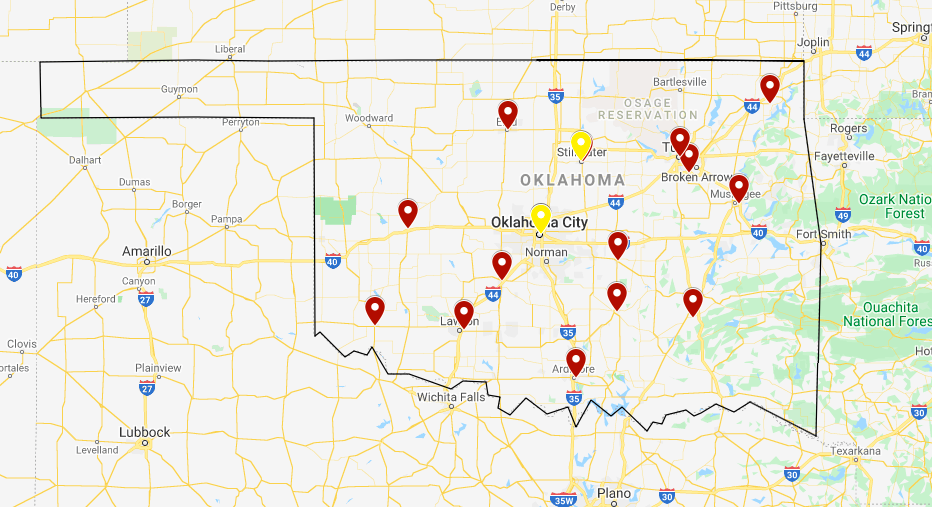
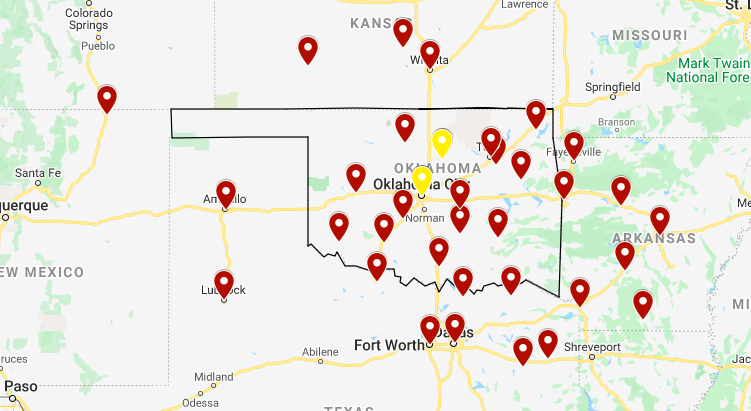
Mapping out these locations proved to show me even more information than what I had originally discovered. Initially, I used this data to create a small map showing the locations of recruitment centers in Oklahoma, my area of focus.

As you can see from this map, there are some gaps in where the recruitment centers reach. I decided to map the recruitment centers in the surrounding states that were close to the borders.

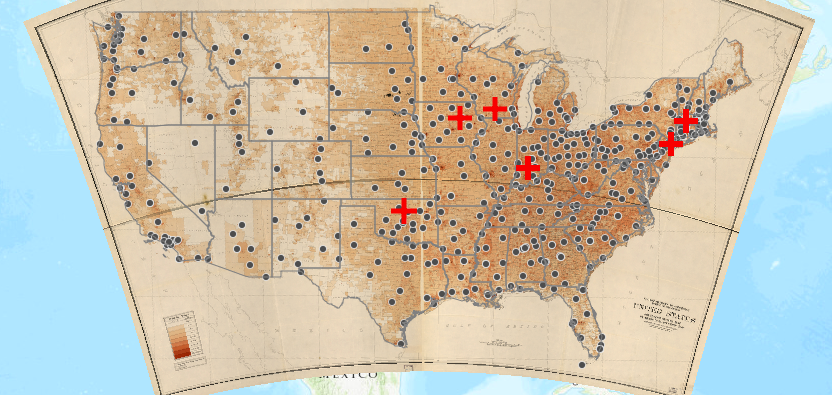
For the most part, the locations of the surround recruitment centers filled in the gaps in Oklahoma, however towards the western end of the state (an extremely rural area) there were hardly any. It was then that we decided to see how the recruitment center placement compared with the population distribution in the 1940s to see the whole country at once.

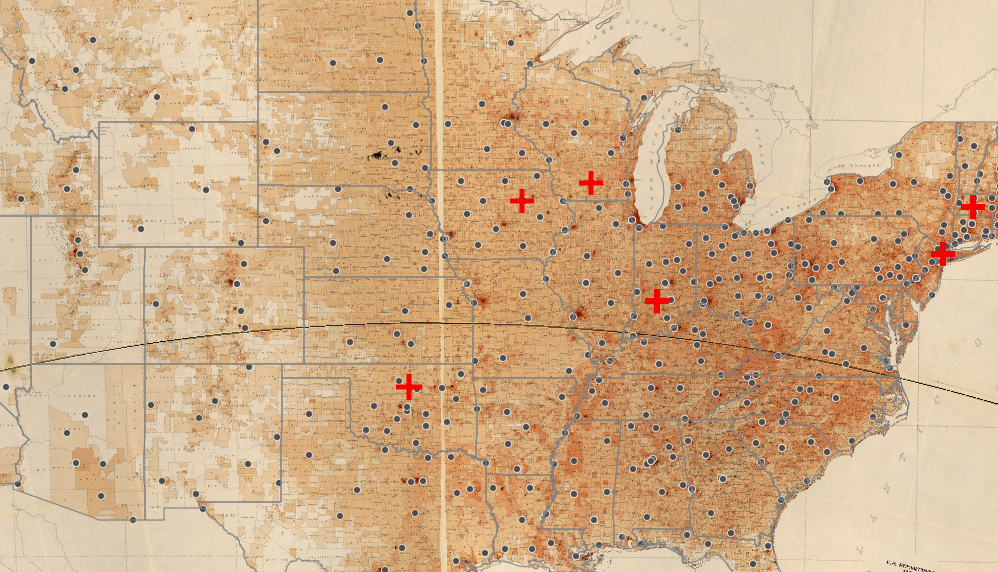
I decided to use a mapping software called ArcGIS for this project. I typed the recruitment center locations into an excel sheet and painlessly uploaded the recruitment centers from the Excel sheet (much to my supervisors’ surprise). In ArcGIS I found a population distribution map from the 1940s to use as a base map and after tinkering with the map’s symbols, I had a lovely map. 

While in some ways this map confirmed some of my suspicions, it raised a plethora of new questions. The recruitment centers, for the most part, correlated to the population density in the 1940s. As you can see in the image below, the middle of the U.S. did not have many recruitment centers as the population was very rural. Towards the coasts, there are more recruitment centers. 

However, this map also shows that there were few recruitment centers in large cities or states with a large number of WAVES. For instance, New York had nearly 1,000 WAVES train at OSU, yet the state only has 24 recruitment centers, with only two in New York City. Even more strange is the number of recruitment centers Oklahoma had: 15! Less than 100 WAVES trained at OSU, yet the state has a massive number of recruitment centers as compared to other states with massive numbers of WAVES recruits. This is incredibly peculiar. 

Unfortunately, I have not been able to find an answer…yet! I am continuing my search as to why Oklahoma had an inordinate number of recruitment centers, as well as why the state became home to a training center. However, this project shows the value of Digital Humanities. Though I had glanced at the list of recruitment centers, I would not have been able to discover the peculiarities of WAVES recruitment if I had not created a map. The purpose of Digital Humanities is to show researchers information that cannot be discovered by simply reading a source. This project effectively proved that to me and I hope that after reading this article you will be convinced too.