Hello, faithful readers! This week we’re celebrating Women’s Military History Week, a week where we’re highlighting the contribution of the WAVES program in World War II. Today, I’m going to be showing you some data visualizations I’ve been working on for the past year. These visualizations are on Tableau Public and through that format you can interact with the data. However, on Tableau Public there is no way to explain what these visualizations mean. The purpose of this blog post, then, is to examine the data so you can better understand the WAVES program.
The data in this set of visualizations comes from the nearly 11,000 WAVES registration cards that the college collected during its time as a training center. I won’t go into much detail here, as I have expounded on this source in previous blog posts. Click here to be taken to the WAVES collection landing page, which is the home base for WAVES week and click here to be taken to my Tableau Public page. Please enjoy!
High School Graduates
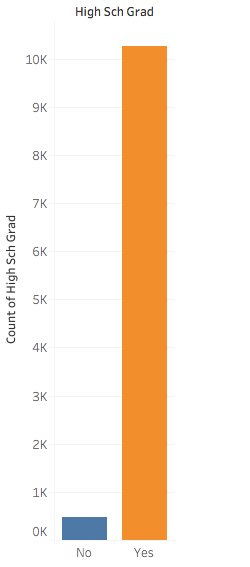
This graph shows the number of WAVES who graduated high school over those who did not graduate. In the WAVES program, graduating from high school was a key requirement to being able to serve. They wanted women who worked hard and were smart, something that graduating from high school indicated. The WAVES program had high standards (such as graduating from high school) for those who joined, which was a key facet to maintaining their good reputation. While a woman could join the WAVES if she had not graduated, she had to fit many more requirements than her graduated counterparts.
Home State
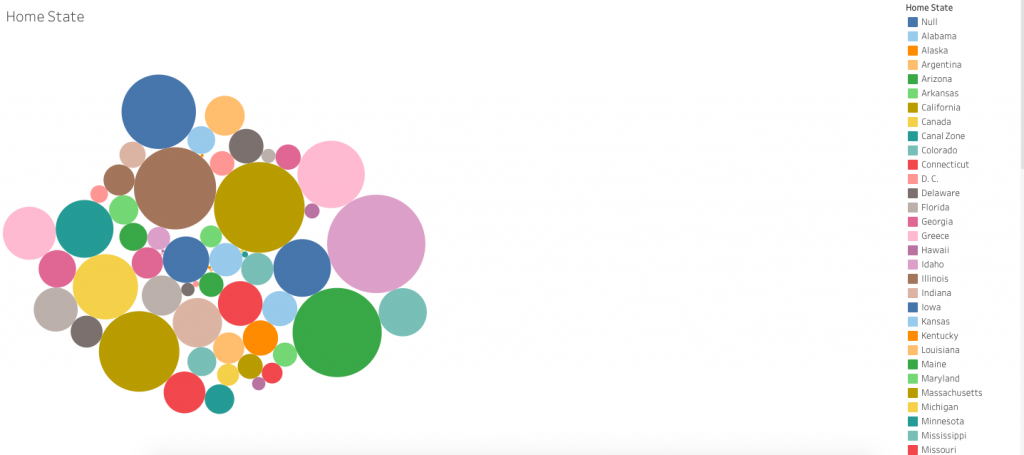
This visualization shows the home states of the women. There is a key on the right side, which you can scroll through on Tableau Public. This was one of the first visualizations that I created and if I were to do it over, I would do it much differently. A heat map would be the best way to show this data, as it would allow viewers to quickly understand the data rather than having to scroll over each circle to see the number. Moreover, it is difficult to compare numbers, as it is harder to compare the sizes of similar circles.
First Names
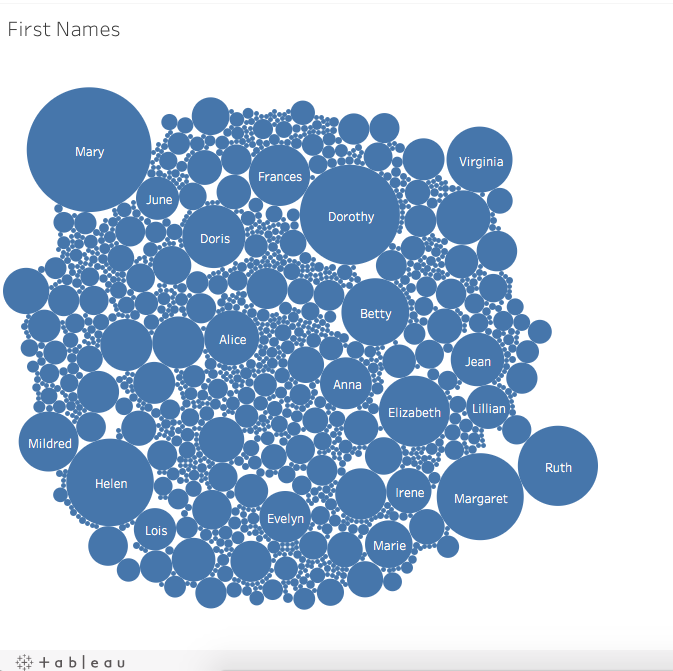
Our final visualization today is rather fun: a bubble graph of the most common first names of the 10,000 women. While the previous visualization probably should not have been a bubble graph, the bubble graph was a good choice for this data. The bubble graph showcases all the data in an easy to see way, showing the viewer the most important parts while subtly downplaying the less common names.
That’s all from that set of visualizations! Tomorrow, there will be more visualizations, so stay tuned and explore the WAVES landing page!