Hello, all! Today I come to you with a blog post about letters from the WAVES. This past year I’ve been exploring the WAVES program at Oklahoma State University and one of the richest resources I’ve used is the letters from the WAVES. These letters can be found in the WAVES online collection and are enjoyable to read. Since my internship focuses on the technical aspect of doing history, I decided to take the data from these letters and run them through Tableau. For a better explanation of creating data and using Tableau, please check out my previous blog posts! Today, however, I will be showing you the data visualizations I created and providing some context. While this blog post only shows a photograph of the visualizations, I’ve included a link to my Tableau Public page where you can interact with the data.
During the WAVES program, several professors from the school of Commerce (Business) at OSU were assigned to teach the WAVES, helping to prepare the women for their clerical duties. One such professor was Mr. Leake. He was a beloved teacher and he and his wife often threw parties at their home for the WAVES. Many WAVES wrote to the Leakes after leaving Stillwater and today, these letters are held in OSU’s collection. These letters are a treasure trove which give us a first-hand account of the WAVES’ experience.
During the 1990s, many WAVES who had trained at OSU began writing to the archives, asking for copies of pictures of the WAVES. While these letters are rather short, they show how far each WAVE went after their service. Many of the letters tell how fondly the women remembered their time at OSU.
These data visualizations tell us more about the WAVES program and their letters. Enjoy!
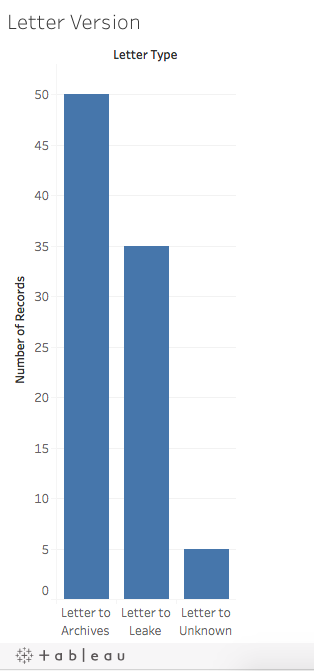
Letter Version

This first image took the total number of letters in OSU’s collection and divided them by whom the letters were written to. Clearly, there are more letters to the archives. The “Letters to Unknown” were written in the 1940s, but it is not clear if they were written to Mr. Leake or a friend or family member.
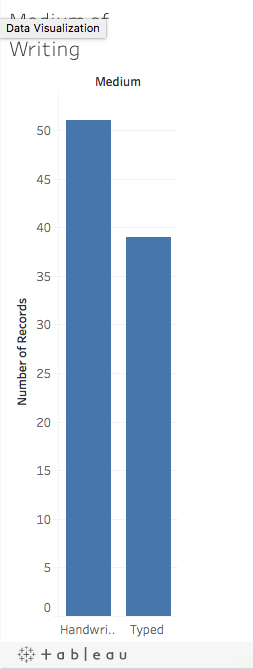
Medium of Writing

The letters were in one of two mediums- hand written or typed. This graph combines all of the letters, including those to the archives. It is a bit surprising that there are more handwritten letters, as the WAVES typed for their jobs. However, this may be explained by the fact that there are more letters to the archives, which are shorter and perhaps did not need to be typed.
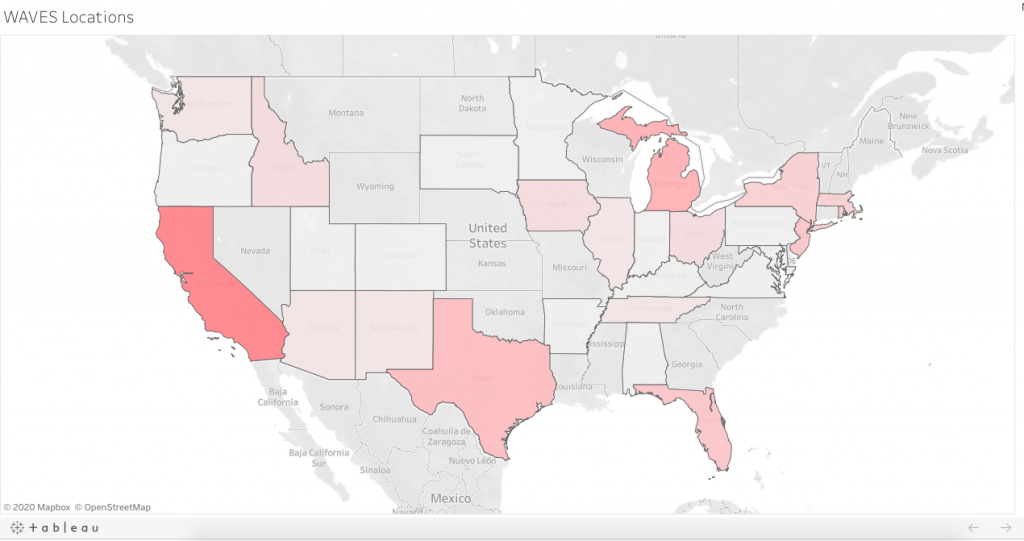
WAVES Locations

This visualization shows where the letters came from. On the Tableau Public Website, you can interact with this image and see how many letters came from each state. As you can see, the darker states had more letters, such as California and Texas. These states had major Naval bases, where the WAVES worked during the war.
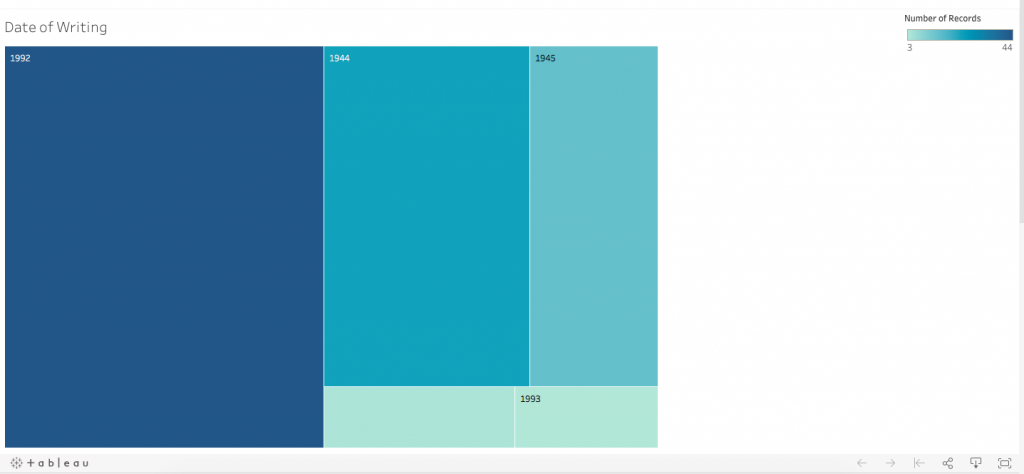
Date of Writing

The image above shows the date that the letters were written. Like the previous visualization, you can interact with the data on the Tableau Public website. As you can see, the vast majority of the letters were written in 1992; these are the letters to the archives, as well as the letters from 1993. The other dates, 1944 and 1945, are letters from the WAVES during their service. There is a blank category, which indicates letters that have no date.
These are all the visualizations from the “Letters from the WAVES” data and I hope that you enjoyed them! Be sure to explore the WAVES landing page and the enjoy the rest of Women’s Military History week.